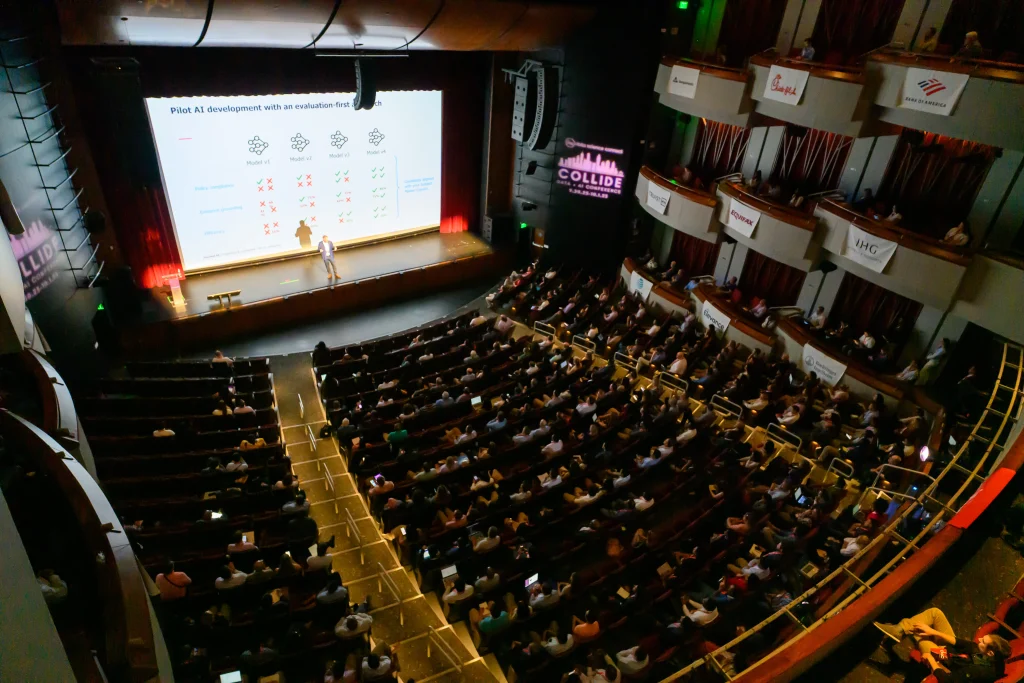




Clients love charts but rarely know which ones they want. At COLLIDE 2025, Broadband Insights CEO Patrick Hutto explained how his team uses vibe analytics with Plotly's AI Studio to explore data with clients in real time, then move the best views into production.
Key takeaways
- Requirements are the bottleneck. Clients struggle to say what charts they want, which can turn one dashboard into weeks of work.
- Explore together in real time. Dropping a CSV into an AI tool lets executives and developers iterate on views in minutes.
- Code to spec, not decisions. Hutto said the model generates visualization code rather than calculating business metrics.
- Mockups become production code. Generated code goes through the normal debug, test and deploy process.
- Fills a gap. Vibe analytics sits between closed BI ecosystems, costly hand coding and chatbots limited by the prompter's imagination.
AI-generated charts can shrink weeks of back-and-forth over what a client wants to see into minutes, Broadband Insights CEO Patrick Hutto told attendees at COLLIDE Data + AI Conference 2025 in Atlanta, in a session sponsored by Plotly. Hutto, who founded the analytics firm serving broadband providers and investors, described how his team uses what he calls vibe analytics with Plotly's AI Studio during exploratory data analysis (EDA), and why he thinks the approach avoids the usual trust concerns about AI-written code.
What does analytics look like in broadband buildouts?
Broadband Insights supports broadband providers, construction companies and private equity firms working to close the digital divide, Hutto said. Fiber networks are capital intensive, and connecting one rural home can cost $8,000 to $12,000. He cited the federal BEAD program at about $42 billion and FCC figures showing 7.2 million U.S. homes still classified as unserved or underserved, with 26% of homes having access to only one provider.
Building a fiber network is a graph problem, he said, so the work combines spatial and graph analysis with financial modeling. One example is utility poles. Applying to attach fiber to a pole can cost $500 to $1,000, and reconfiguring a pole that lacks clearance can cost $5,000 to $10,000. His team uses lidar and photogrammetry analysis with cost modeling to color-code poles red, yellow or green, then runs graph analysis to find the most cost-effective routes.
The firm also builds investor reporting that tracks financial and operational metrics such as homes passed, cost per foot, sales and churn. That work is highly structured. An investor who gets a monthly spreadsheet for three years "wants it to look the exact same way," Hutto said.
Why is exploratory data analysis so slow with clients?
Getting to those production dashboards is the hard part, according to Hutto. Everyone loves charts, he said, but ask what they want to see and the conversation stops or goes sideways. Clients might sketch a dashboard on a napkin or hand over a list of 300 things they'd like to track.
Each request means finding the source system, writing code to pull the data, snapshotting it, quality-checking it and building views. His team can spend weeks on a Sankey diagram of customer churn, he said, only to hear the client would prefer a bar chart.
What is vibe analytics?
Hutto defined vibe analytics as an AI-driven, code-based approach that lets users interact with data through natural language conversation, similar to brainstorming. With early access to Plotly's AI Studio, his team can drop in a CSV, such as a client's customer packages, with as much or as little context as they like. The model interprets the columns and suggests views, like a time series of declining packages or a scatter plot of churn by region.
That puts the executive and the developer in the same room, adjusting charts in real time. When the team loaded its data set of about 5,000 analyzed poles, the tool produced an interactive, filterable map with the classifications. "It generated a map. I didn't have to code a map," Hutto said. It also produced charts he hadn't thought of, such as a histogram of pole clearances.
The user stays in charge, he said. When the tool suggests something unhelpful, you can quickly reject it and ask for something else.
Can you trust AI-generated analytics code?
The common critique of vibe coding is that the code can't be trusted, Hutto acknowledged. His answer is that in EDA the model is "really just building code to spec. It's not calculating my customer's churn." It generates the code to display data, such as pie charts, line graphs and basic pandas and Polars work, which speeds development without making analytical decisions.
He positioned the approach between existing options. BI tools like Tableau and Power BI are strong but keep users inside their ecosystems and require training. "Hand coding is the gold standard," he said, but many of his clients are smaller providers without budgets for data science teams. And chatbots, while useful, are "kind of limited to the imagination of the prompter," answering the question asked rather than surfacing patterns no one thought to request.
How does vibe analytics move from exploration to production?
Hutto described three uses. The first is exploration. The second is mockups: once a client picks the view they like, such as on-time installation performance or mean time to repair, the generated code can be copied into production and go through the team's normal debug, test, commit and deployment process.
The third, which he attributed to Plotly's longer-term vision, is self-service. Executives who won't open Python or a Jupyter notebook could explore curated data exported from the firm's data lake. That work won't go into production, he said, but it may spark ideas for the next report.
His team's pipeline uses Dagster for ingestion, Postgres for geospatial and tabular data, and Plotly Dash for production apps, caching and security, with daily snapshot reports emailed to clients. Hutto said the team is trialing Databricks.
See practical AI analytics at COLLIDE 2027
COLLIDE, the largest AI conference in the Southern U.S., brings more than 1,000 enterprise data and AI leaders to Atlanta for hands-on sessions like this one. The 2027 conference takes place Wednesday, October 13, 2027, at the Sandy Springs Performing Arts Center. Learn more at COLLIDE, or watch tools in action during Data Science Connect's free AI Demo Days and other live webinars.
Frequently asked questions
What is vibe analytics?
Hutto defined it as an AI-driven, code-based approach that lets users explore data through natural language conversation, similar to brainstorming.
Can you trust AI-generated analytics code?
In exploratory analysis, Hutto said, the model builds code to spec for charts and basic data work rather than calculating metrics like churn, so it mainly speeds development.
How does AI help exploratory data analysis?
It can interpret a data set's columns, suggest charts and maps, and let clients and developers adjust views in real time instead of spending weeks on requirements.
Does vibe analytics replace BI tools?
Not according to Hutto. He described it as complementing tools like Tableau and Power BI and hand coding, especially for teams without data science budgets.
Watch: Vibe Analytics for EDA on YouTube
Event: COLLIDE AI Conference · More coverage: COLLIDE AI Conference insights