

Python Capacity Planning App with Plotly Dash at Cox Automotive
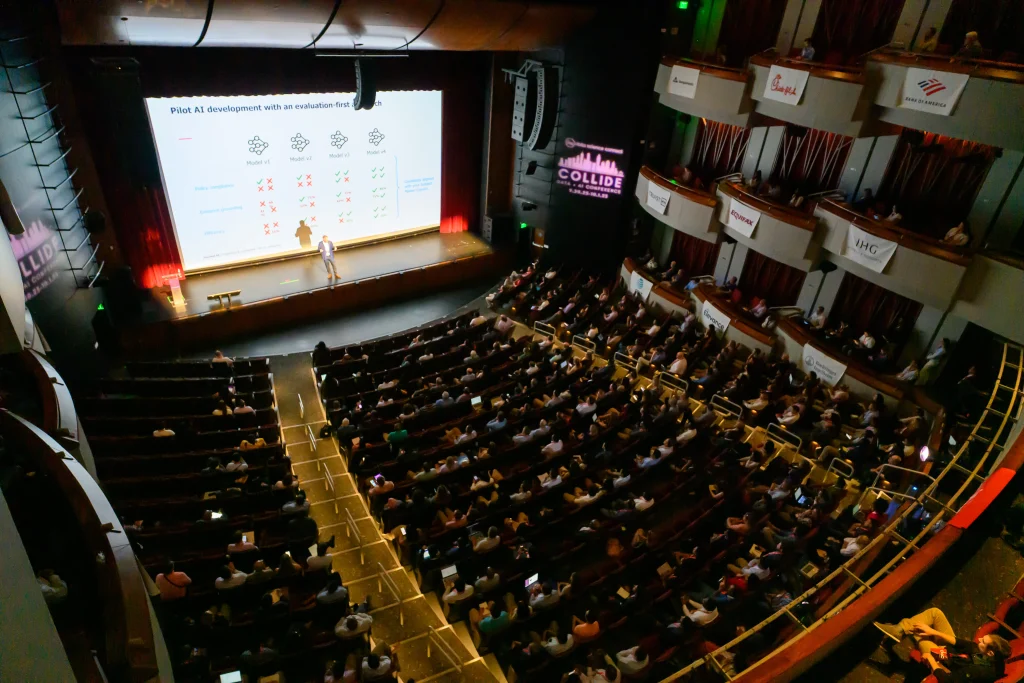
At COLLIDE 2023 in Atlanta, Cox Automotive's John Kang described how Manheim moved capacity planning from Excel to a Python app built with Dash Enterprise and Plotly Professional Services. The tool helps 50-plus auction sites plan technicians and equipment through scenario planning.
By The AI Enterprise Magazine Team4 min read

Key takeaways
- Excel hit its limits. Kang said volume and complexity of questions outgrew Excel, which lacked scalability and real-time data.
- Build vs buy, a third path. Consultants and off-the-shelf software were too slow or costly, so the team built in Python.
- Enterprise needs mattered. Okta-integrated authentication and consistent branding drove the move from open-source Dash to Dash Enterprise.
- Scenario planning builds trust. Users see results change in real time from their own inputs, which Kang said increased adoption.
- Faster data refresh. Updates that took weekly or monthly effort now take minutes or hours.
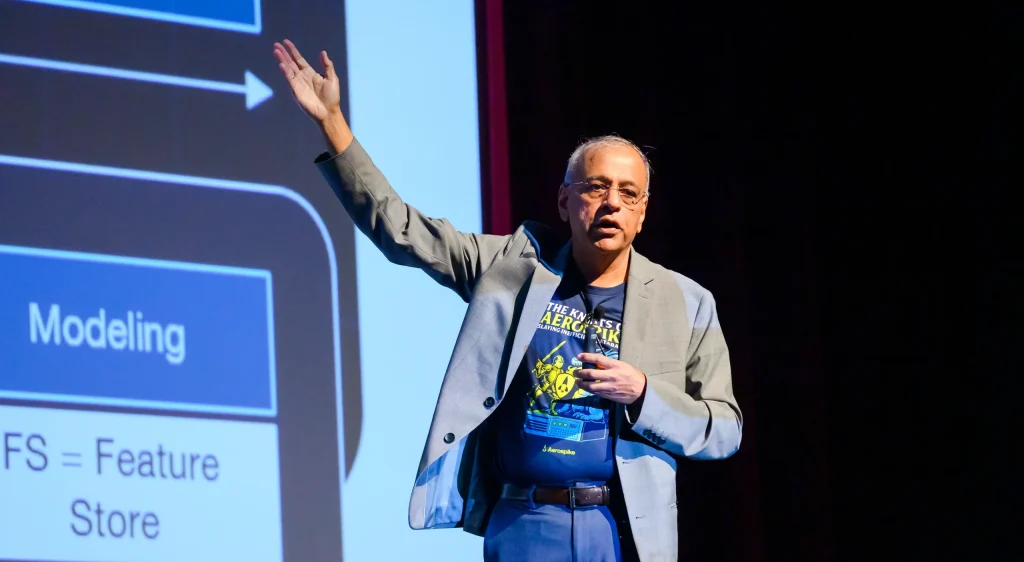
At COLLIDE Data Conference 2023 in Atlanta, John Kang, Director of Planning Analytics and Industrial Engineering at Cox Automotive, described how his team replaced Excel models with a Python-based data app built on Dash Enterprise and Plotly Professional Services. The tool helps Manheim auto auction sites decide how many technicians and how much equipment they need. Kang gave the talk in a session on Plotly's platform.
What problem was Cox Automotive trying to solve?
Kang supports Manheim, which he described as the largest North American auto auction network, with more than 50 U.S. sites. His task was to plan skilled labor and equipment across those sites as demand varied.
The pressure began in summer and fall 2020, he said, when key clients asked Manheim to ramp up capacity as COVID restrictions eased. The operation in question is reconditioning, in which cars are repaired, restored and renewed so they can go through the auction or be sold to consumers through dealers. Manheim faced high growth, high overtime and missed customer service-level agreements, he said.
The constraints were practical. Technicians take time to hire and ramp up, and equipment such as lifts and paint booths has long lead times, so the company needed answers well before it needed capacity.
Why did Excel stop working?
The team started in Excel, bringing in data and answering questions such as whether a site could handle a 100% increase in demand. That worked until the volume and complexity of questions grew. "Excel broke," Kang said, adding that it was not scalable or reliable and had no real-time information.
He said two alternatives were considered. Consultants could build custom software, but that would be costly and slow to integrate. Off-the-shelf capacity software was often built with manufacturing in mind and would need heavy customization. Neither fit the team's limited budget and time, Kang said.
Why Python and Dash?
The team moved its data and models from Excel and Alteryx into Python to increase the speed and complexity of the questions it could answer. For the interface, Kang said, Dash was the most popular and most customizable of the Python dashboarding libraries, and the team built a proof of concept in open-source Dash.
What did Dash Enterprise and Plotly Professional Services add?
Kang said the team moved to Dash Enterprise for two reasons. First, security: managing authentication in the open-source version was "not a great experience," and the team needed integration with tools such as Okta. Second, the app had to look like other internal data applications to build trust and adoption across 50-plus sites and corporate leadership. He said the upgrade was fairly seamless.
His team was small, with two industrial engineers who were not professional software developers. Plotly Professional Services, the company behind Dash, accelerated development and brought practices such as CI/CD, code reviews, app testing and committing code to repositories, along with UI and UX experience matching corporate styling, he said.
What does the application do?
Kang showed two main pages. The multi-site view lets corporate and regional leaders see demand, supply and capacity across auctions at a point in time, with red, yellow and green indicators flagging sites of concern. Models rerun quickly as users change filters, he said.
The single-site view lets general managers and their teams see capacity over time and run scenario planning. The model is fed defaults for data, demand and forecast, and users can change inputs. In his example, raising technician proficiency, the efficiency of converting a technician's hours into billable hours, changed the capacity available for new demand. Kang said seeing results change from their own inputs increased users' trust and adoption.
What return did the team report?
Kang listed six points:
- A proof of concept became an application quickly, with a low investment.
- Authentication and security met IT requirements by integrating with existing tools.
- A branded, consistent interface lowered barriers for non-technical users.
- Data updates that once took weekly or monthly effort now take minutes or hours, using Snowflake and a Dash Enterprise process that loads data into Redis and Postgres for speed and resilience.
- The app was built entirely in Python, avoiding the cost of front-end developers.
- A multi-page, branded design answers different questions in one application.
How does it compare with Tableau or Power BI?
Asked about performance versus tools like Tableau and Power BI, Kang said callbacks let a changed input rerun a series of Python models in the background, which he called difficult in those tools. Writing in Python also means the app is not constrained by drag-and-drop tools, he said.
Asked whether users could game the scenario inputs, he said defaults come from historical averages, are easy to reset and are not changed for other users. The team also includes quality as an input. "We don't want to just push our people to work harder and harder and reduce quality," Kang said.
Where to see more production data apps
COLLIDE 2027, the largest AI conference in the Southern U.S. with more than 1,000 enterprise data and AI leaders, takes place Wednesday, October 13, 2027, at the Sandy Springs Performing Arts Center in Atlanta. See COLLIDE. AI Connect also hosts 24 free live webinars on its 2027 schedule at webinars.
Frequently asked questions
Why did Cox Automotive move from Excel to Python?
Kang said Excel broke as the volume and complexity of questions grew, and it was not scalable or reliable and had no real-time information.
Why move from Dash open source to Dash Enterprise?
Kang cited security, including integration with Okta, and theming and branding so the app matched other internal tools.
What does the capacity planning tool do?
It shows demand, supply and capacity across Manheim auction sites and lets users run scenarios, such as changing technician proficiency.
How does Dash compare with Tableau or Power BI?
Kang said callbacks rerun Python models when inputs change, which is difficult in those tools, and Python lets teams customize the app.
This article is based on remarks by John Kang, Director of Planning Analytics and Industrial Engineering, Cox Automotive at COLLIDE Data + AI Conference 2023 on October 3, 2023. More coverage: COLLIDE AI Conference.
Filed under: AI Use Cases & Applications, Data & AI Infrastructure