Semantic Layer Explained: Ontology and Inference Demo from Stardog
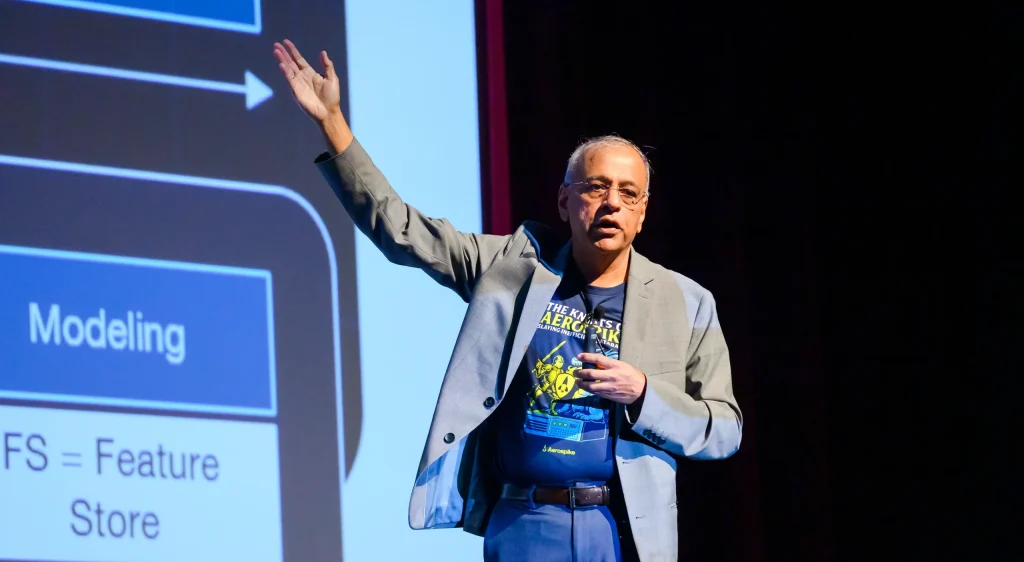
In a session at the Data Science Innovators Conference 2023, Stardog knowledge graph consultant Joe Fagan built a semantic layer live on the royal family tree. He showed how ontology rules and inference add facts that never appear in the source data.
By The AI Enterprise Magazine Team4 min read
Key takeaways
- Read, don't copy. Fagan said the graph reads data at query time, never writes back and does not need to ingest it.
- Ontology is schema plus domain rules. Rules such as parent, sibling and cousin apply to any data set that fits the domain.
- Inference creates new facts. Switching on reasoning surfaced cousins and siblings that were not in the source tables.
- Different teams, different models. One data set can support separate models, such as HR and manufacturing views, with role-based security.
- Start small. Fagan said a simple model can answer queries in about 30 minutes and a whole-company model might take around six weeks.
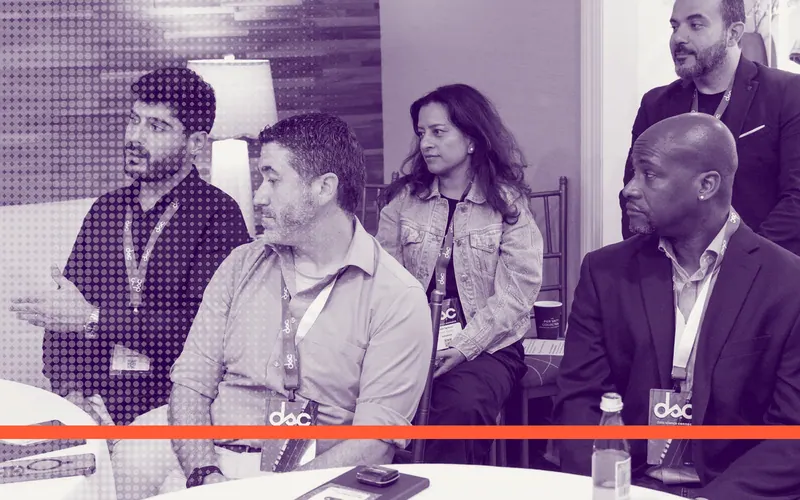
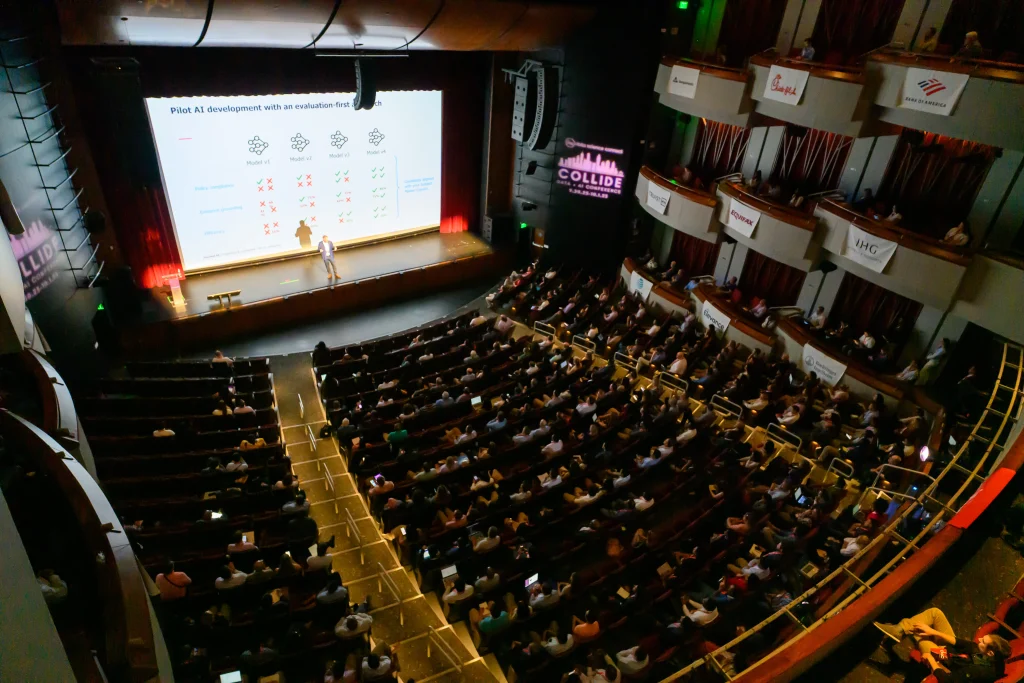
In a session at the Data Science Innovators Conference 2023, Joe Fagan, a knowledge graph consultant at Stardog, walked attendees through a live demonstration of how a semantic layer turns plain relational data into a knowledge graph. Fagan, who is based in the United Kingdom, built the model from a deliberately simple data set, the British royal family, and used it to explain what an ontology is and what "semantic enrichment" means in practice.
The session, titled "Understanding the Power of a Semantic Layer: Royal Edition," followed a keynote the previous day in which a colleague defined the semantic layer using the same family-tree data.
What is an enterprise knowledge graph?
Fagan described a knowledge graph as a data fabric that sits between data consumers and the underlying sources. Those sources are usually relational tables, but can include NoSQL databases and text files. He said Stardog has connectors to 100 data sources.
The graph does not need to ingest anything. "We're just another reader of the data," Fagan said, pulling data at query time and never writing back, which he called a relief to data governance teams. Organizations can start with a few tables and one use case, such as a recommendation engine, and expand the graph as they add sources.
Consumers can then use the data through an explorer tool, through Python and machine learning libraries, or as tables through a BI SQL layer feeding tools such as Tableau.
What does semantic enrichment mean?
Fagan separated raw statements in the data from statements about the domain. The data says Queen Elizabeth has child Charles. The domain rules say a parent is a person who has a child, a grandparent is the parent of a parent, and an uncle is the male sibling of a parent. Both are written as subject-predicate-object triples.
Those rules are the ontology. "Ontology is just a kind of fancier word for the schema," he said. Because the rules describe the domain and not one data set, they can be applied to any family tree.
Combining the two produces new knowledge, such as Queen Elizabeth being the grandmother of Prince William. Fagan compared this to his young daughter working out that her father's brother is her uncle, which showed she understood the concept and was not simply repeating a definition.
How does the demo work in practice?
In Stardog Designer, Fagan created a project, added a file of royal family members and let the platform map it to a class with name, gender and ID attributes. He then added a "has child" relationship and populated it from a link table of parent and child IDs.
At that stage, he said, the result was a graph database with "little or no semantic enrichment." He then added rules: an inverse "has parent" relationship, a sibling rule that finds two people sharing a parent, and a cousin rule that follows a parent's sibling to that sibling's child.
After publishing the rules to the same database and switching on reasoning in the Explorer, Harry's record showed his cousins, siblings and parents, none of which were in the source data. Fagan said these facts are created on the fly at query time and not stored, so they stay current as the data changes. The same logic works for queries: his "granddaughters of Charles" query could be saved as a rule.
Where else do graph queries apply?
Fagan asked attendees to imagine the same structure as a supply chain, with warehouses and shops. Shortest-path queries could weigh cost, distance or time, and the graph could test resilience if a port were knocked out. In manufacturing, siblings become shared raw material, and a common-mode failure becomes a question about a shared ancestor.
He gave customer examples, as he described them. A pharmaceutical customer used a shortest-path query to surface a possible link between a compound and a disease through intermediate genes and proteins. For insurance fraud, he said graphs can detect "over-connected" groups of claimants, a pattern he said SQL databases struggle to find. He also described a manufacturing traceability problem where mapping the data and building the ontology without code gave the customer what he called the best traceability his industry had seen.
What did attendees ask?
On whether companies use pre-built or custom ontologies, Fagan said both work. Established industry ontologies, such as shared definitions of a recipe and its prep and cook times, can be ingested, or teams can start from scratch.
On how often Stardog polls sources, he said that by default it queries live data. Teams that do not want to burden a mission-critical database can add a cache refreshed on a schedule, such as 5 a.m. daily, which suits analytics and machine learning more than transaction processing.
Rules live in the database, and different departments can have separate models, including language-specific views, with role-based security. For deployment time, he said a simple model over three or four tables can answer queries in about 30 minutes, while a whole-organization business model might take around six weeks.
Where to keep learning about data and AI
Semantic layers and knowledge graphs remain a staple of AI Connect programming. The free 2027 webinar schedule includes 24 live sessions across four series, from the AI × Enterprise Panel Series to AI Demo Days and Plug & Play. Browse the lineup at /webinars/; registration for 2027 events is coming soon.
Frequently asked questions
What is a semantic layer in a knowledge graph?
Fagan described it as a fabric between data consumers and sources that adds business meaning, such as rules and relationships, without copying the underlying data.
What is an ontology?
He called it a fancier word for a schema: statements about a domain, like a grandparent being the parent of a parent, that apply to any data set in that domain.
How often does a knowledge graph refresh from source data?
By default Stardog queries live data. Teams can add a cache refreshed on a schedule if they do not want to burden a mission-critical database.
How long does a first knowledge graph use case take?
Fagan said a simple model over three or four tables can answer queries in about 30 minutes, while a very complex organization-wide model might take about six weeks.
This article is based on remarks by Joe Fagan, Knowledge Graph Consultant, Stardog at Data Science Innovators Conference 2023 on April 12, 2023. More coverage: More AI Connect Events.
Filed under: Context, Semantics & RAG, Data & AI Infrastructure